
Gold has long been considered a symbol of wealth and prosperity. Its value has transcended time and borders, making it a popular investment choice for individuals and governments alike. In the world of finance, one tool that investors often rely on to track the value of gold is the gold price chart. This chart provides a visual representation of the price movements of gold over a specific period, allowing investors to analyze trends and make informed decisions. In this blog, we will explore the significance of the gold price chart and how it reflects global economic trends.
Understanding the Gold Price Chart
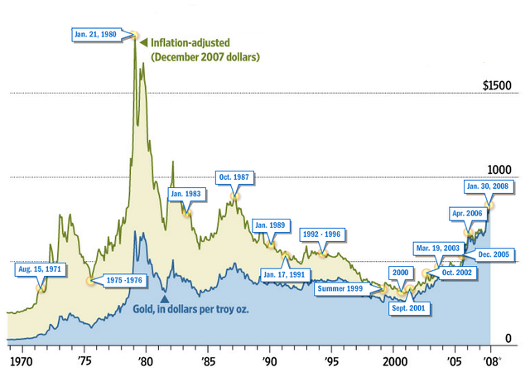
The gold price chart is a valuable tool for investors and traders who are interested in the precious metal market. It provides a visual representation of the historical performance of gold prices over a specific period of time. By analyzing the patterns and trends depicted on the chart, individuals can gain insight into the factors that influence the price of gold and make informed decisions about buying or selling.
One of the key aspects of understanding the gold price chart is recognizing the relationship between supply and demand. Gold is a finite resource, and its availability in the market is influenced by factors such as mining production, central bank reserves, and recycling. When demand for gold exceeds supply, the price tends to increase, and vice versa. By studying the chart, investors can identify periods of high demand or supply and anticipate price movements accordingly.
Impact of Economic and Geopolitical Events
Another factor to consider when interpreting the gold price chart is the impact of economic and geopolitical events. Gold is often seen as a safe haven investment during times of uncertainty or volatility in the global economy. For example, during periods of economic recession or political instability, investors tend to flock to gold as a means of preserving wealth. These events can be reflected in the chart as sudden spikes or dips in the gold price.
In addition to supply and demand dynamics and external events, technical analysis plays a crucial role in understanding the gold price chart. Technical indicators, such as moving averages, support and resistance levels, and trend lines, can help identify patterns and predict future price movements. Traders often use these tools to determine entry and exit points for their gold trades.
It is important to note that the gold price chart should not be viewed in isolation. Other factors, such as inflation, interest rates, currency fluctuations, and market sentiment, can also impact the price of gold. Therefore, it is advisable to consider these variables alongside the chart analysis to form a comprehensive understanding of the gold market.
Factors Affecting the Price of Gold
Various factors influence the price of gold, and these factors are often reflected in the gold price chart. Here are some key factors to consider:
Supply and Demand
Supply and demand play a crucial role in determining the price of gold, as indicated by the gold price chart. The chart reflects the historical data of gold prices over a specific period of time, allowing us to observe the fluctuations in supply and demand dynamics.
When the demand for gold increases, its price tends to rise. Several factors influence the demand for gold, such as economic uncertainties, geopolitical tensions, and investor sentiment. During times of economic instability, investors often turn to gold as a safe haven, increasing its demand and consequently driving up the price.
On the other hand, the supply of gold is influenced by factors like mining production, recycling, and central bank reserves. If the mining production of gold increases, it leads to a higher supply. This may put downward pressure on its price. Similarly, if central banks decide to sell their gold reserves, it can also impact the supply and subsequently the price.
The gold price chart serves as a useful tool for investors and analysts to analyze trends and make informed decisions. By studying the historical patterns, one can identify the factors that affect supply and demand, enabling them to anticipate future price movements.
Inflation and Currency Fluctuations
Inflation and currency fluctuations have a significant impact on the gold price chart. When inflation rises, the value of currency decreases, leading investors to seek alternative stores of value like gold. This increased demand for gold drives up its price. Similarly, currency fluctuations affect the gold price as well.
A weak currency makes gold more expensive for holders of that currency, while a strong currency makes gold relatively cheaper. Investors often monitor the gold price chart as a gauge of economic stability and as a hedge against inflation and currency risks. The gold price chart reflects the intricate relationship between inflation, currency fluctuations, and the value of gold.
Geopolitical Uncertainty
Geopolitical uncertainty has a significant impact on the gold price chart. As tensions rise between nations, investors seek safe-haven assets like gold, causing its price to surge. The chart becomes a reflection of global instability and risk aversion. Geopolitical events such as political conflicts, trade disputes, or economic sanctions can trigger sudden fluctuations in gold prices.
Investors closely monitor these events, analyzing the chart for potential opportunities or risks. Geopolitical uncertainty creates a volatile environment, where the chart acts as a barometer, indicating the level of global insecurity and investor sentiment.
Central Bank Policies
Central bank policies play a significant role in influencing the gold price chart. When central banks implement expansionary monetary policies such as quantitative easing (QE), it can lead to an increase in the money supply, potentially devaluing the currency. As a result, investors often turn to gold as a safe haven asset, driving up its price. Conversely, when central banks tighten monetary policy, it may have a negative impact on the gold price as investors seek higher-yielding investments. Central bank announcements related to interest rates, inflation, or economic stability can also cause fluctuations in the gold price, reflecting market sentiment and investor confidence.
Interpreting the Gold Price Chart
Analyzing the gold price chart requires careful observation and interpretation. Here are a few key points to consider when interpreting the chart:
Trends
The Gold price chart reflects the trends in the value of gold over a specific period. In recent years, the gold market has experienced various trends. One trend is the rise in gold prices driven by global economic uncertainties. Investors often turn to gold as a safe-haven asset during times of market volatility. Another trend is the impact of inflation on gold prices.
When inflation rises, the value of paper currencies decreases, leading to an increased demand for gold. Additionally, geopolitical tensions and central bank policies can influence gold prices. Keeping an eye on the chart helps investors make informed decisions in this dynamic market.
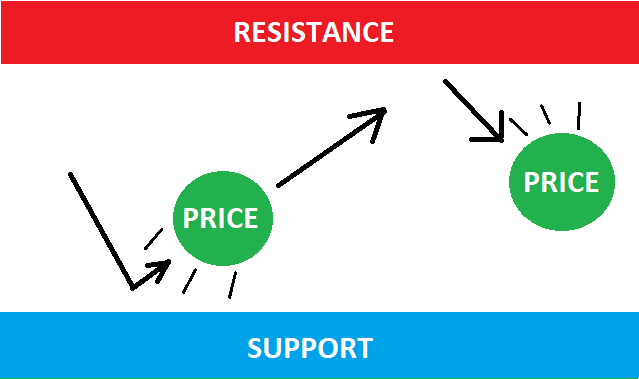
Support and Resistance Levels
Support and resistance levels play a crucial role in analyzing the chart. It refers to a price level where the demand for gold is strong enough to prevent it from falling further. Traders often see this level as a potential buying opportunity. On the other hand, resistance level represents a price level where selling pressure is significant, preventing gold from rising further.
Traders may consider selling or taking profits at this level. Identifying these key levels can help traders make informed decisions, set entry and exit points, and manage risk effectively. They provide valuable insights into market sentiment and potential price reversals.
Volatility
Volatility refers to the rapid and unpredictable changes in the price of an asset, such as gold. The chart can illustrate this phenomenon vividly. In times of economic uncertainty, the gold price chart may experience sharp fluctuations as investors seek a safe haven. Geopolitical tensions, inflation concerns, and market sentiment can all contribute to this volatility. Traders closely monitor the gold price chart to identify trends and make informed decisions.
Volatility in the gold market can present both opportunities and risks for investors, requiring a cautious approach. Understanding the patterns and factors influencing the gold price chart is crucial for navigating this volatile market.
Correlations
Consider the correlation between the gold price and other economic indicators, such as stock market indices, interest rates, or inflation rates. Understanding these correlations can help investors gauge the overall health of the economy and make more informed decisions.
The Gold Price Chart as an Economic Indicator
The gold price chart is not only a tool for investors but also serves as an economic indicator. Changes in the price of gold can reflect broader economic trends and sentiments. For example:
Inflation Expectations
When the price of gold rises, it can indicate expectations of higher inflation. Investors see gold as a hedge against inflation, and increased demand for gold can be a sign of inflationary pressures in the economy.
Market Confidence
During times of economic uncertainty or market volatility, the price of gold often rises as investors seek safe-haven assets. A significant increase in the gold price may indicate a lack of market confidence or concerns about the economy.
Currency Strength
The price of gold is often influenced by currency fluctuations. A weakening currency can lead to higher gold prices as investors seek alternative stores of value.
Conclusion
The gold price chart is a powerful tool that provides valuable insights into the dynamics of the gold market and reflects global economic trends. By analyzing the chart, investors can identify patterns, trends, and correlations, helping them make informed decisions. However, it is important to remember that the chart is just one piece of the puzzle and should be considered alongside other economic indicators and factors. Whether you are a seasoned investor or a curious observer, the chart offers a fascinating glimpse into the world of finance and the global economy.


